

There is no translation available.
Markets are chasing the highest valuations in history. And as usual, they are cheered on by an increasingly puerile mainstream media. Barron’s didn’t even wait for the ink to dry on the Dow Jones Industrial Average’s 20,000 print before declaring in a new cover story: “Next Stop Dow 30,000.” Barron’s argues that “[t]he Dow hitting 20,000 was no fluke. Today’s stock prices are well supported by corporate earnings and economic growth. In fact, if President Trump can avoid stumbling into a trade war – or a real war – the Dow could surpass 30,000 by the year 2025.” Leaving aside that this National Enquirer-style headline is a desperate attempt to pump up readership and is followed by an article lacking a modicum of analytical substance, let’s take a serious look at claims that corporate earnings and the economy are strong. The facts tell a different story than the one Barron’s tries to sell.
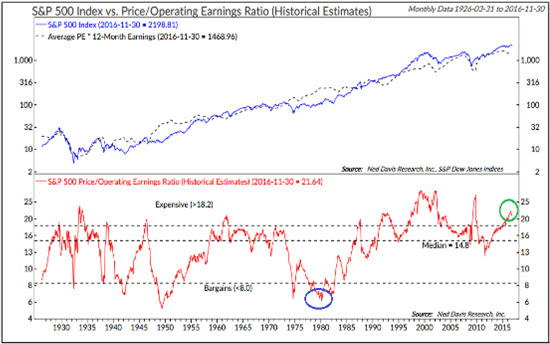
Corporate earnings have been weak for the last two years. According to Factset, estimated non- GAAP earnings growth for S&P companies in 2016 was a paltry +0.1% (and GAAP earnings growth was negative). Revenues were up roughly 2.0%, which is zero growth once you back out phony government inflation data and negative if you use real world prices. In 2015, S&P 500 earnings declined year-over- year on both a GAAP and non-GAAP basis. But even these figures really don’t tell how poorly businesses are performing because GAAP and non-GAAP earnings are inflated by low effective corporate tax rates, low interest rates on the money borrowed to buy back stock and pay higher dividends, and sluggish wage growth. US corporations are significantly more leveraged than they were on the cusp of the financial crisis in 2007, a condition disguised by record low interest rates that are now rising. So-called non-GAAP S&P 500 earnings (which are best considered “earni ngs as we would like them to be” rather than as they actually are) are more than $20 per share higher than GAAP earnings. With almost half of companies reporting so far for 4Q16, the full year estimate for 2016 S&P 500 non-GAAP earnings is $108.66 and GAAP earnings is $97.98 This puts the market multiple at 21.1x trailing non-GAAP earnings and 23.4x GAAP earnings.4 By way of comparison, this multiple was 24x non-GAAP earnings during the Internet Bubble. Other valuation metrics such as the Shiller Cyclically-Adjusted P/E at 28.4x (versus a mean of 16.7x) and the S&P Market Cap/GDP Ratio of 125% are also at extreme levels. There are other signs of excess as well such as margin debt running above $500 billion compared to $380 billion at the market top in 2007. Wall Street strategists trying to tempt investors into buying more stocks at these levels are playing with fire.
And Dow 20,000 isn’t what it seems. Drawing historical comparisons between index levels is an inexact science due to the fact that the composition of these indices changes over time. The composition of the Dow Jones Industrial Average has changed over time. As economist extraordinaire David Rosenberg points out, if the eight companies that were replaced in the Dow since April 2004 had remained in the index, we would be reading about Dow 12,886, not Dow 20,000.5 Also, as a price-weighted index, moves in certain stocks have an outsized impact on the Dow, creating false impressions about the overall strength of the market. For example, moves in Goldman Sachs Group (GS) have eight times the impact on the Dow as those of General Electric (GE), a factor that contributed to the index’s post-election rally. Tracking the Dow may make for good financial television (actually, nothing makes for good financial television today other than Realvision TV, bu t that’s a topic for another day), but it is comparing apples and oranges and means little analytically. All Dow 20,000 accomplishes is getting investors all stirred up that they are missing a rally. They should be careful what they wish for.
The chase to peak valuations is occurring in a weak economy. Barron’s claim that economic growth justifies not only Dow 20,000 today but Dow 30,000 in eight year is malarkey. Barron’s ignores the fact that fourth quarter GDP sputtered to 1.9% and kept full year 2016 growth at a disappointing 1.6%, the slowest since 2011 and down sharply from 2015’s 2.6% pace. Last year marked the 11th consecutive year that America failed to reach 3% growth, the longest period since the Bureau of Economic Analysis started reporting GDP. U.S. industrial production has declined on a year-over-year basis for 15 consecutive months and the capacity utilization rate is a disappointing 75% (a level considered contractionary). And let us not forget that this tepid growth was boosted by eight years of zero interest rates and trillions of dollars of QE; without that support, the economy likely would have shrunk. Claiming that robust economic growth supports hi gher stock prices is nonsense. Stock prices are primarily supported by cheap money and, as we will see in a moment, important structural forces in the markets.
Stocks enjoyed quite a run since Election Day. But even before Donald Trump surprised the world and won the U.S. presidency, stocks were on an epic run that began in March 2009 at the depths of the Great Financial Crisis. The most impressive aspect of this bull market is that it defied the worst economic recovery in the last century and survived eight years of Obama administration policies that were hostile to economic growth and markets.6 As noted above, rather than based on a solid economic foundation, the bull market benefitted from zero interest rates, lower corporate tax payments, wage suppression and financial engineering in the form of epic levels of debt-funded M&A, stock buybacks and dividend increases. These factors have little to do with the fundamental financial condition of American corporations (in fact, some of these factors weaken their condition). Eight years later, this leaves the markets (and the individual companies comprising them) overva lued and overindebted.
But the important question for investors is not where the market has been but where it is going. Right now, it would be imprudent to fight the sentiment pushing stock prices higher. Donald Trump’s presidency represents a sharp break not only with the awful Obama years but the Bush II administration as well. The new president is laying waste to decades of failing domestic and foreign policies. It is hardly surprising that investors are willing to ignore serious structural impediments to growth in order to give the new president the benefit of the doubt. This sentiment will likely calm down once the realities of governing within the American constitutional system set in, but for the moment fighting the tape is a tough gig.
By Michael Lewitt
Excerpted from The Credit Strategist
February 1, 2017