There is no translation available.
A picture strikes much than a thousand words...
The following graph shows total consumer credit in the USA as of 2017 compared to 2008. It is composed of automobile loans, student loans, credit cards, consumer credit mainly.
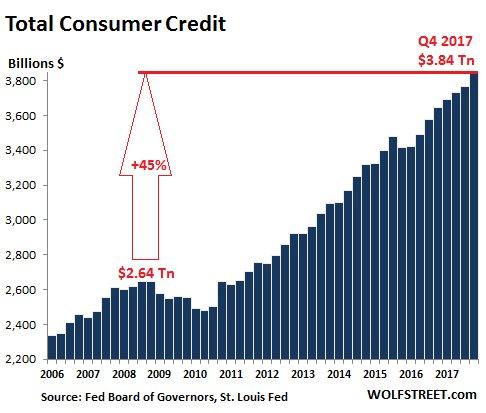
Would you say that US household revenues have climbed 45 % during the same period ? Or that demography in the USA has grown impressively to sustain a consumer credit growth of 45 % in a nine-year period of time ?
Or, is this the result that US households think they feel richer than nine year ago ?